Market Mosaic · Annual Report

Global Market
Outlook Report
2026

Part I: 2025 in Review — Key Market Drivers & Part II: 2026 Predictions & Strategic Implications

3.3%
Projected Global GDP 2026
72%
Enterprise AI Adoption
$2.2T
Clean Energy Investment
$3.3T
Total Energy Investment

AI adoption and clean energy investment trend chart for 2025

2025 Key Indicators
GDP Growth AI Adoption Clean Energy Trade Flow
Table of Contents
01
Economic FundamentalsGDP & inflation trends · Trade & supply chain disruptions · Consumer impact
02
Technological AdvancementsAI adoption rates · Digital infrastructure · AI personalization · Trust & adoption
03
Sustainability & Regulatory ShiftsClean energy investment · EV growth · Sustainable product adoption
04
Five Key Forces for 2026Economic divergence · AI acceleration · Climate · Trade · Labour market
01
Part I · 2025 in Review — Key Market Drivers

Economic
Fundamentals

Global GDP divergence · Inflation cooling · Trade disruptions · Commodity volatility · Consumer behaviour shifts

Global GDP growth diverged sharply between advanced and emerging economies

The global economy in 2025 presented a complex picture of divergent regional performances and shifting inflation dynamics. Advanced economies experienced moderate growth averaging 1.8-2.2%, while emerging markets demonstrated more robust expansion at 4.1-4.5% year-over-year (IMF, 2025)

Among major economies, India remained the fastest-growing, expanding at approximately 6.5%, supported by domestic demand and public investment. China's growth moderated to 4.0–4.7%, reflecting structural adjustments. Together, these trends highlight a world economy increasingly driven by emerging markets rather than advanced economies.

CHART 1.1: Global GDP Growth by Region, 2024-2025 Comparison

1.8–2.2%
Advanced Economy GDP Growth
IMF, 2025
4.1–4.5%
Emerging Market GDP Growth
IMF, 2025
6.5%
India — Fastest-Growing Major Economy
IMF, 2025
4.0–4.7%
China Growth — Structural Adjustment
IMF, 2025

CHART 1.2: Inflation Rate Trends, 2025

Inflation pressures that had dominated the 2022-2023 period continued their cooling trajectory throughout 2025. Advanced economies saw inflation rates decline from approximately 4.2% at year-end 2024 to a more manageable 2.5-3.0% by Q4 2025, approaching central bank targets in many jurisdictions. The United States navigated a particularly delicate balance, with the Federal Reserve managing to achieve a “soft landing” scenario as inflation approached the 2% target while unemployment remained relatively stable around 4.0-4.3%.

Trade and Supply Chain Disruptions: Impact on Commodity Prices and Export Volumes

Global trade lost momentum in 2025 as tariff escalation and geopolitical uncertainty weighed on cross-border flows. Growth in global goods and services trade slowed to approximately 1.7–2.0%, marking a sharp deceleration from prior years. Rising trade barriers, including an increase in the effective U.S. import tariff rate to around 14%, combined with geopolitical tensions to disrupt trade flows and raise costs across global supply chains.

📌
Key Takeaway

2025 tariff activity impacted 24 to 39 percent of supply chain baseline; supply chain cost drove most industry variability.

Unlike the acute, shock-driven disruptions of the pandemic period, the 2025 slowdown reflected a more structural realignment of global trade patterns. Elevated trade policy uncertainty increased effective trade costs and weakened investment appetite, prompting firms to reassess long-standing sourcing and production strategies. As a result, manufacturing footprints and logistics networks continued to shift toward configurations that prioritized resilience and risk diversification over scale efficiency.

Tariff escalation played a central role in this adjustment. Rather than relying on short-term rerouting, companies increasingly redesigned production footprints to reduce exposure to geopolitical risk and cost volatility. This strategic change slowed trade expansion and capital deployment, reinforcing a broader move toward regionalization and supply chain diversification.

Chart 1.3: Portion of supply chain baseline impacted by 2025 global tariff · Source: McKinsey & Company, 2025

Chart 1.4: Impact of 2025 Tariff Activity on Global Supply Chains

Companies reliant on China-based production have increasingly pursued diversification strategies. Production concentration gave way to multi-hub strategies as firms sought to mitigate tariff risk and regulatory uncertainty. Vietnam emerged as a key beneficiary, with exports to the United States rising nearly 30% year-on-year in early 2026, extending a trend that persisted despite ongoing tariff constraints. Export volumes from major manufacturing hubs reflected the ongoing geographic diversification. Vietnam, Mexico, and Poland gained market share as alternative production locations, while traditional export powerhouses in East Asia adapted their value propositions toward higher-value manufactured goods and technology

Chart 1.4: Industries Most Impacted by 2025 Global Tariff Announcements · Source: McKinsey, 2025

Commodity markets experienced geopolitical and weather-driven volatility

Commodity markets experienced notable volatility driven by geopolitical tensions and weather-related disruptions. Energy prices remained elevated but volatile.

Agricultural commodities experienced sharper volatility. Weather-related disruptions in key producing regions drove price fluctuations, particularly in food staples and soft commodities. These pressures reinforced inflation sensitivity in food markets, even as broader price levels eased.

CHART 1.3: Key Commodity Price Movements, 2025 · Source: World Bank, 2025

Industrial metals presented a mixed picture in 2025. Copper prices strengthened by an estimated 12–15%, supported by sustained demand from electrification, grid expansion, and energy transition investments. In contrast, iron ore prices softened by roughly 8–10%, reflecting continued weakness in China's construction and property sectors.

Precious metals followed a different trajectory. Gold prices rose by approximately 10–15% over the year, supported by elevated geopolitical risk, central bank purchases, and persistent demand for safe-haven assets amid policy uncertainty. Silver prices were more volatile but broadly higher, benefiting from both safe-haven flows and industrial demand linked to solar and electronics, though gains lagged gold due to weaker cyclical manufacturing momentum.

Chart 1.5 gold and silver prices in US$/troy ounce (toz)

Sectoral Growth Patterns in 2025

Sectoral performance in 2025 was uneven, with growth increasingly concentrated in productivity-enhancing industries. Technology and digital services continued to outperform, driven by enterprise investment in cloud computing, AI, cybersecurity, and healthcare technology. These sectors benefited from corporate focus on efficiency, automation, and risk management.

CHART 1.4: Global Sectoral Growth Rates, 2025

Manufacturing growth varied dramatically by sophistication level

Global manufacturing output grew 2.2% year-over-year. Advanced manufacturing segments such as semiconductors and precision equipment outpaced traditional heavy industries, reflecting continued capital reallocation toward higher-value production

Chart 1.6 Global index of manufacturing production

Services demonstrated resilient 3.8% global expansion

Services demonstrated resilience as global mobility normalized. Tourism, hospitality, and professional services rebounded strongly, supported by pent-up demand and renewed business activity

Chart 1:7 Structure of World Exports of Commercial Services

Technology sectors maintained robust 6.5–7.8% growth

Technology sectors with B2B enterprise focus (AI, cybersecurity, healthcare tech) are outperforming consumer-focused categories by an average of 11.3 percentage points, indicating businesses are prioritizing operational efficiency investments over consumer experience enhancements.

Chart 1.8: Equity investments technology trends in 2024.

Energy: In 2025, the energy sector continued its trend toward renewables. At the same time, the rapid expansion of data centres and other technology infrastructure increased electricity demand across both advanced and emerging economies. This highlights the growing challenge of meeting rising energy needs while continuing the transition to low-carbon sources.

CHART 1.5: Total energy demand

Consumer Impact: How Economic Pressures Affected Household Budgets and Value-Seeking Behaviour

0.8–1.5%
Real wage growth in advanced economies — first positive reading since 2021
24–26%
E-commerce penetration of total retail sales in advanced economies
8–10%
Buy-now-pay-later penetration in e-commerce transactions

The cumulative effect of several years of elevated inflation fundamentally altered consumer behaviour patterns in 2025, creating lasting changes in purchasing priorities and brand relationships. Real wage growth turned positive in many advanced economies for the first time since 2021, averaging 0.8-1.5%, yet consumers remained cautious, shaped by the purchasing power erosion experienced in prior years.

Chart 1.10.: Real Wage Growth vs. Inflation, 2021-2025. The chart show total buildup of price increases and wage growth over the past 4–5 years.

Private label gained 3–5 percentage points of market share

Value-seeking behaviour became deeply embedded across all consumer segments. Private label and store brand market share increased 3-5 percentage points across major retail categories as consumers discovered quality alternatives to national brands. This change proved particularly pronounced in grocery, personal care, and household products where brand premiums faced intense scrutiny.

Trading down patterns emerged clearly in discretionary categories. Consumers delayed major purchases, extended replacement cycles for durable goods, and shifted toward smaller pack sizes and budget-friendly alternatives.

Chart 1.11 Private label contribution to value growth, 2025

E-commerce reached 24–26% of total retail sales

Digital channels continued gaining share as consumers leveraged technology for price comparison, coupon aggregation, and deal-seeking. E-commerce penetration reached 24-26% of total retail sales in advanced economies, driven partly by consumers' ability to efficiently compare prices and access value options unavailable in physical stores.

Experience Spending Rebounds: A Tale of Diverging Consumers

Experience-based spending rebounded strongly despite economic pressures, with consumers prioritizing travel, dining, and entertainment after years of restricted access. This spending came partly at the expense of goods purchases, reflecting a values realignment toward memorable experiences and social connection.

Value vs. Luxury: The Rise of a Divided Consumer Market

The rise of the “cash-strapped consumer” created a split in retail performance. Discount and value-oriented retailers gained market share, capturing households constrained by tighter budgets. Meanwhile, premium and luxury segments also performed well, catering to affluent consumers relatively insulated from economic pressures. Middle-market retailers faced the greatest challenges, squeezed between value-conscious shoppers and high-end buyers, highlighting the uneven impact of economic pressures across the retail spectrum.

Chart 1.12 Index of Consumer Sentiment Within Income Terciles

Buy-now-pay-later reached 8–10% penetration in e-commerce

Buy-now-pay-later services expanded rapidly, reaching 8-10% penetration in e-commerce transactions, providing payment flexibility but also masking underlying affordability challenges for some households.

Sustainability evolved from premium feature to value consideration

Sustainability considerations evolved from premium features to value considerations, with consumers seeking products offering durability and longevity rather than disposability. This shift supported growth in repair services, resale platforms, and products marketed on total cost of ownership rather than upfront price alone.

02
Part I · 2025 in Review — Key Market Drivers

Technological
Advancements

AI adoption at 72% · Cloud & semiconductor growth · AI personalization · Trust, privacy & control

AI and Digital Transformation: Adoption Rates Across Industries

The year 2025 marked a pivotal inflection point in artificial intelligence adoption, transitioning from experimental proof-of- AI adoption rates reached 72% among large organizations globally, up from 58% in 2024, representing the fastest year-over-year increase since tracking began.

The surge came from tangible results rather than just hype. Executives prioritized cost efficiency, workflow automation, risk management, and revenue optimization. In many boardrooms, the conversation changed from “Should we use AI?” to “Where are we not yet using it?”

The data shows a gap between scale and growth. Finance and professional services lead in enterprise adoption, while technology, healthcare, and manufacturing grow fastest. Education and entertainment lag in both scale and momentum, reflecting structural or budget constraints.

CHART 2.1: Enterprise AI Adoption Scale vs. YoY Growth Rates by Industry, 2024 vs 2025

Financial services led with the highest AI adoption scale, with banks focusing on fraud detection, risk modelling, trading analytics, and customer service automation. Healthcare followed with 78% adoption in hospital systems and 65% in private practices, where AI-assisted radiology shortened interpretation times by 30–40% and improved early detection rates for high-risk conditions by 15–20%, while drug discovery timelines fell from 4–5 years to roughly 18–24 months. Manufacturing also increased, with predictive maintenance reducing unplanned downtime by up to 30% and computer vision systems cutting defect escape rates by 35–45%.

Retail and transportation saw broad adoption, at 71% and 74% respectively, driven by personalization, pricing optimization, route planning, and AI-coordinated warehouse systems. Energy companies reached 68%, improving renewable forecasting accuracy by 20–30%, while agriculture accelerated to 54%, cutting input costs by 15–20% with precision tools. The public sector remained lowest at 47%, though where implemented, AI reduced service processing times by 40–50%. Across industries, AI adoption reflects a pattern of targeted efficiency gains, operational automation, and strategic investment in high-impact applications.

Digital Infrastructure: The Foundation Beneath AI

AI adoption was enabled by years of digital transformation. Large enterprises matured in cloud migration, favouring hybrid and multi-cloud setups, while edge computing expanded to support IoT applications. Growing IoT networks across industries and cities generated vast data that fuelled AI systems, creating a cycle of infrastructure and intelligence growth. At the same time, rising AI capabilities made cybersecurity essential, with zero-trust architectures and AI-assisted threat detection becoming standard.

According to the World Intellectual Property Organization, global R&D expenditure recently topped roughly $2.8 trillion as economies increased investment in innovation. This represented 2.63% of global GDP, the highest share on record, reflecting intensified competition in areas such as AI, biotechnology, semiconductors, and clean energy. The surge in R&D investment not only fueled new product development but also reinforced the infrastructure supporting AI adoption across industries, from cloud computing to IoT-enabled operations.

72%
Enterprise AI Adoption — Fastest Rise Since Tracking Began
McKinsey, 2025
$2.8T
Global R&D Expenditure — Record High
WIPO, 2025
2.63%
R&D as Share of Global GDP — Highest on Record
WIPO, 2025
19%
Cloud Infrastructure Market Growth YoY
Gartner, 2025

AI and Industry Transformation: Tracking Market Share change in Core Technology Sectors

Cloud Infrastructure

The global cloud infrastructure services market in 2025 reached $345-360 billion in 2025, growing 19% year-over-year. Market dynamics showed both consolidation among hyperscalers and specialization through vertical-specific offerings. AI workloads became a primary revenue driver, reshaping enterprise cloud spending patterns.

Cloud Infrastructure Market Share 2024 vs 2025

CHART 2.2: Cloud Infrastructure Market Share, 2024 vs 2025

Semiconductor Industry

The global semiconductor market reached $625-640 billion in 2025, supported heavily by AI-driven demand. High-performance GPUs and AI accelerators reshaped revenue distribution within the industry. Data center expansion became a central growth engine as enterprises and cloud providers scaled AI training and inference capacity.

Semiconductor Market Share

CHART 2.3: Semiconductor Market Share

NVIDIA captured 18% of semiconductor market revenue, driven by strong demand for high-value GPUs and AI chips, with data center revenue surpassing $90 billion. Growth was fueled by AI training and inference needs, though competition from AMD, Intel, and custom cloud-provider chips (Amazon's Trainium, Google's TPU, Microsoft's Maia) signals potential pressure on future market share.

AI Models and Services: Platform Competition

The AI model development and deployment services market emerged as a distinct category reaching $85-95 billion in 2025, growing 58% year-over-year as enterprises moved from experimentation to production deployment. Investment in AI model development continues to accelerate. The chart below tracks the cost trends for AI models in 2025, highlighting how pricing varies by provider and model complexity, and signalling the commercial pressures shaping adoption decisions across organization.

AI Model Cost Trends

CHART 2.4: AI Model Cost Trends

CHART 2.5: Total General AI Assistant Usage

OpenAI led the commercial AI API market with a 34% share, though rising competition from open-source models began to challenge its dominance. GPT-4 and GPT-4.5 remained the standard for complex reasoning. Google's Gemini captured 22%, leveraging strong integration with Google Cloud and Workspace. Anthropic's Claude models reached 14%, gaining traction for safety, reliability, and extended context capabilities, appealing to enterprises focused on governance and transparent operations.

Consumer Impact

AI-driven personalization transformed consumer experiences across digital and physical touchpoints in 2025, creating unprecedented customization while simultaneously raising concerns about privacy, manipulation, and algorithmic bias. Consumer responses reflected this tension, with adoption driven by convenience and value balanced against scepticism about data usage and autonomy.

CHART 2.6: Frequency of Consumer AI Use, 2025

Virtual assistant usage increased. Generative AI tools gained adoption for writing, research, and learning support, but confidence in output accuracy remained measured. Many users reported routinely verifying AI-generated responses.

Personalization drove measurable engagement gains for companies. However, consumer sentiment surveys consistently showed elevated privacy concerns. A significant share of adults expressed worry about how AI systems collect and use personal data

CHART 2.7: Consumer Trust in AI Applications, 2025

AI Personalization in E-Commerce and Retail

AI-driven personalization in retail has become increasingly sophisticated. Leading e-commerce platforms now use AI to tailor product recommendations, pricing, content, and customer service. Customers exposed to these personalized experiences converted 20–25% more often than those seeing generic offerings, though gains began to taper as optimization reached maturity.

CHART 2.8: Consumer Perceptions of AI Personalization Benefits

AI Personalization in Healthcare and Finance

Healthcare AI tools are gaining traction but adoption remains measured. About 29% of consumers use AI symptom checkers, 24% interact with mental health chatbots, and 18% use AI fitness or nutrition advisors. Wearables with AI health insights reached 32% penetration in developed markets, offering continuous monitoring and predictive alerts.

In financial services, AI-driven advisory tools reached 36% adoption among investment account holders, managing $2.1–2.3 trillion globally and growing 28% year-over-year. AI is also increasingly used in credit and lending, with 82% of applications processed with AI assistance, improving speed and accuracy, though algorithmic bias concerns remain in 15–20% of models, prompting regulatory reviews.

Trust, Privacy, and Control

Consumer attitudes toward AI personalization remain cautious, with acceptance depending on the use case, sensitivity of data, and perceived risk. Privacy concerns are rising: 58% of consumers reported taking at least one step to limit AI data collection in the past year, up from 51% in 2024. Common measures included disabling personalization features (34%), using ad blockers (42%), deleting apps over privacy worries (28%), and opting out of data sharing when possible (31%).

As AI chatbots become integral to daily digital interactions, questions around data collection and privacy have intensified. Consumers increasingly seek to understand what information these systems gather and how it is used. The following chart highlights the relative data-harvesting practices of leading AI chatbots, providing a snapshot of the volume and scope of user information collected across popular platforms.

How much data do top AI chatbots really harvest

CHART 2.9: How much data do top AI chatbots really harvest

In 2025, AI adoption among consumers grew rapidly, driven by convenience and functionality, yet integration remained cautious. Privacy, accuracy, bias, and autonomy concerns limited trust, making acceptance conditional and context-dependent. Companies that combined clear data practices with meaningful user control built higher trust and sustained engagement, while those prioritizing optimization over consumer agency faced resistance.

03
Part I · 2025 in Review — Key Market Drivers

Sustainability &
Regulatory Changes

$2.2T clean energy · EV deceleration · Sustainable packaging · Income-tier adoption gap

Sustainability gained further momentum in 2025, with regulatory frameworks maturing and green investments reaching record levels despite policy uncertainties. Consumers increasingly favored eco-friendly products, accepting premiums for verified sustainability amid growing environmental awareness.

Clean energy investment hit $2.2 trillion, outpacing fossil fuels for the 10th consecutive year

According to international energy investment data, global energy investment reached a record $3.3 trillion in 2025, with $2.2 trillion representing 67% of total spending directed toward clean energy. This marked the 10th consecutive year that clean energy investment surpassed fossil fuel spending, solidifying a structural shift in capital allocation.

Chart 3.1: Global Investment in Clean Energy and Fossil Fuels (Billion USD), 2015-2025 · Source: World Resource Institute

Solar captured 52% of renewable investment at $465 billion, wind took 35%

Global investment in renewable energy technologies remained strong, with investment in new renewable projects reaching new record levels in early 2025 and continuing the multi-year trend of rising capital flows into clean power infrastructure. According to data from BloombergNEF's Renewable Energy Investment Tracker, renewable energy investment climbed to a record $386 billion in the first half of 2025, up 10% year-on-year, driven by solar and wind deployment alongside energy storage growth.

$2.2T
Clean Energy Investment — 10th Year Leading
IEA, 2025
67%
Share of Total Energy Investment Going Clean
IEA, 2025
28%
Sustainable Packaging Growth in 2025
BNEF, 2025
67%
Repeat Purchase Rate for Sustainable Products
NYU, 2025

EV investment hit $245 billion but growth decelerated 13 points to 15%

Electric vehicle and charging infrastructure investment totalled $245 billion in 2025, growing 15%, down from 28% in 2024. This 13-percentage point deceleration reflected market maturation in leading regions, particularly China and Europe where EV penetration exceeded 25% of new sales.

Chart 3.2 tracks global electric vehicle (EV) sales between 2024 and 2025, highlighting both overall growth and regional market dynamics. EV sales continued to rise, reflecting expanding consumer adoption, government incentives, and investments in charging infrastructure. The chart highlights a change in investment focus from expanding production capacity to advancing technology, improving grid integration, and expanding charging networks, which will influence the future growth of EV adoption.

Chart 3.2: Global EV Sales (2024-2025, '000 units) · Source: Benchmark, 2025

Sustainable products market will grow from $433 billion to $480 billion with 11% CAGR

The sustainable products market has grown rapidly in recent years and is projected to increase from $432.67 billion in 2025 to $480.17 billion in 2026, representing a compound annual growth rate (CAGR) of 11% (The Business Research Company, 2025).

Growth did not come from consumer demand alone; it was reinforced and, in many cases, accelerated by regulation. Policies such as the EU's single-use plastics directive, extended producer responsibility programs across 47 countries, and binding corporate sustainability commitments compelled companies to transition toward recyclable and compostable materials, reshaping packaging standards across industries.

Cost remains a significant barrier to wider adoption. Sustainable packaging typically carries a 12–18% price premium compared to conventional alternatives. As a result, adoption has advanced most rapidly in markets where regulation mandates compliance or where brands can justify higher prices through strong positioning, differentiation, and consumer willingness to pay.

Sustainable products market forecast

Sustainable Products Market Forecast · Source: The Business Research Company, 2025

Sustainable packaging grew 28% to $412 billion, capturing 34% market share

Sustainable packaging adoption accelerated in 2025, growing 28% to reach $412 billion and capturing 34% of the $1.21 trillion global packaging market, up five percentage points from 29% in 2024. At current growth rates, sustainable formats could account for the majority of packaging demand by 2028–2029.

Adoption varied by category. E-commerce led with a 42% sustainable share, followed by food and beverage at 38%, while consumer goods trailed at 31%. The gap reflects where sustainability is most visible and marketable: direct-to-consumer brands and food categories have leveraged clearer messaging and stronger consumer willingness to pay, while more price-sensitive segments have moved more gradually.

Chart 3.8: Sustainable Product Market Share by Category, 2023-2025

Affluent consumers drove adoption—income tier correlation proved decisive

Survey data shows that 68% of consumers say they are willing to pay more for environmentally friendly products, up from 63% in 2024. However, actual purchasing behavior reveals a significant gap: only 31% consistently choose sustainable alternatives when prices are more than 10% higher, creating a 37-percentage-point difference between intention and action.

Income levels strongly influence this pattern. The Sustainability Purchase Index shows that consumers in the top income quartile are 2.3 times more likely to purchase sustainable products than those in the bottom quartile. Middle-income households fall in between, purchasing at about 1.6 times the baseline rate. These findings reflect practical budget constraints. Higher-income consumers are more able to absorb sustainability premiums, while middle- and lower-income households prioritize affordability, slowing broader market adoption until prices become more competitive.

Sustainability Purchase Index Income Tiers

Chart: Sustainability Purchase Index – Income Tiers · Source: NYU, 2025

Consumers support sustainability in principle. At checkout, price still decides.An industry retail analyst summarized the fact succinctly

Sustainable product loyalty exceeded conventional by 23 points at 67%

Sustainable product buyers show stronger loyalty despite higher prices. Repeat purchase rates averaged 67%, compared to 44% for conventional products, giving sustainable items a 23-point advantage. Across consumer-packaged goods, these buyers generated 34% higher lifetime value.

Branded sustainable products also proved more resilient to inflation-driven moves toward private labels. While conventional brands lost 4.2 percentage points of market share to store brands in 2024–2025, sustainable branded products lost only 1.8 points, a 2.4-point defensive edge that underscores the protective value of sustainability credentials and their contribution to brand equity.

The verdict: Sustainability moved from premium to mainstream, but economics remain decisive

In 2025, sustainability became more mainstream, but adoption depended on economics. Regulations, such as extended producer responsibility, boosted uptake, while cost and scale influenced consumer behavior. Affluent consumers bought sustainable products 2.3 times more than lower-income groups, and when premiums exceeded 10%, many reverted to conventional options. Overall, progress hinges on cost alignment, regulation, and affordability rather than environmental values alone.

Interactive Tool

How do these trends affect
your business?

Use our Global Market Calculator to model the impact of 2025's key forces on your organisation — from tariff exposure to AI adoption ROI and sustainability cost premiums.

📈
Global Market Impact Calculator
Model how 2025's five key forces affect your business — from tariff exposure and AI ROI to sustainability cost premiums and consumer spending shifts across income tiers.
✓ Trade & Tariff Impact ✓ AI Adoption ROI ✓ Sustainability Costs ✓ Consumer Spending Models
Launch Calculator ↗
04
Part II · 2026 Predictions & Strategic Implications

Five Key Forces
Defining 2026

Economic divergence · AI acceleration · Climate resilience · Trade realignment · Labour transformation

The year 2026 will be shaped by five interconnected forces: economic divergence, AI acceleration, climate adaptation, trade realignment, and labor transformation. These forces will not operate independently. They will interact; amplifying volatility, widening inequality, and reshaping competitive advantage. The result is a global environment that remains resilient, but increasingly fragmented. Agility, localization, and tech-enabled resilience will replace pure efficiency as the primary strategic imperative.

📊
Force 01
Economic Divergence: Growth Splits Further

Global GDP is projected at 3.3% in 2026, (IMF,2025) but growth will be uneven. Emerging markets are expected to expand 4.8%, while advanced economies slow to 1.6%, widening the gap to 3.2 percentage points. Demographics, productivity differences, fiscal constraints, and trade exposure are driving structural separation. Strategy in 2026 becomes regional rather than global.

IMF, 2025 · Strategy becomes regional, not global
🤖
Force 02
AI Acceleration: From Tool to Autonomous Agent

Artificial intelligence will move beyond experimentation in 2026 and become embedded directly into core business operations. AI systems will increasingly function as autonomous agents capable of completing multi-step tasks with minimal human supervision.

Enterprise AI investment is projected to reach $178 billion, representing 38% growth year over year, (Open AI,2025). Spending on generative AI alone will triple to $124 billion. Although model costs are expected to decline by roughly 45%, overall expenditure will rise sharply as adoption expands and usage volumes scale.

AI agents are forecast to reach 340 million deployments, automating approximately 28% of knowledge-based tasks. Around 4.2 million roles may be displaced, while an estimated 6.8 million new roles emerge in AI-related and complementary fields. Wage growth will diverge, with AI-enhanced roles experiencing gains of more than 8% on average, while routine roles see limited growth.

The result is a significant reallocation of work, accompanied by widening income inequality as demand concentrates in higher-skill, technology-aligned roles.

OpenAI, 2025 · From tool to autonomous agent
🌍
Force 03
Rising Climate and Cybersecurity Risks: The Imperative for Resilience in 2026

In 2026, climate and cyber risks will intensify. Extreme weather damages are projected at $340 billion, while adaptation investment rises to $185 billion 48% higher than 2025 but still $95 billion below estimated needs (UNEP,2025).

Cybersecurity risks grow alongside digital expansion and AI adoption, increasing exposure for critical infrastructure, energy grids, and supply chains. In 2026, strategies will move beyond emissions reduction to focus on operational resilience, emphasizing climate-proof infrastructure, robust cybersecurity, and more resilient food and urban systems.

UNEP, 2025 · Resilience beyond emissions reduction
🔄
Force 04
Trade Realignment: Permanent Risk Mode

In 2026, tariffs and geopolitical fragmentation will continue to reshape global supply chains. Prices for tariff-exposed goods such as electronics, apparel, and other imported products are expected to rise noticeably as import costs are passed through to consumer prices. In response, companies are transforming their strategic focus from purely minimizing costs to building resilient operations. Diversification of suppliers, nearshoring production, and introducing redundancies in logistics and manufacturing networks are becoming priorities.

Permanent risk mode · Nearshoring accelerates
👷
Force 05
Labor Transformation: Skills Mismatch Widens

In 2026, an estimated 68 million workers globally will face skills obsolescence, while approximately 52 million positions will remain unfilled due to shortages in high-demand fields such as artificial intelligence, engineering, and green economy sectors (ILO, 2026). Employment in the green economy is projected to grow to 38 million workers, spanning renewable energy installation, energy efficiency retrofitting, electric vehicle manufacturing, sustainable agriculture, and environmental services, yet training pipelines are expected to lag by 6.2 million qualified workers. Wage gaps between high- and low-skill workers will widen to 22% (World Bank, 2026), reflecting a structural realignment that demands targeted reskilling and strategic workforce planning.

ILO, 2026 · World Bank, 2026 · Skills mismatch widens
🛍
Consumer Impact
A Barbell Economy Strengthens

The five structural forces shaping 2026; economic divergence, AI acceleration, climate costs, trade pressures, and labor market changes, will directly reshape how consumers spend, save, and prioritize purchases.

Spending growth will become increasingly uneven. Households in the top income quartile are projected to increase spending by approximately 6.4%, supported by wage gains in high-skill sectors and stronger asset performance. In contrast, the bottom income quartile is expected to grow spending by just 1.8%, with many households effectively experiencing flat or negative real growth after inflation. This widening gap reinforces a two-speed consumer economy.

Value-seeking behavior will intensify. Private label and store brands are projected to reach 34% market share as consumers prioritize affordability in essentials such as groceries, household goods, and personal care. Discount retailers and bulk formats will gain share, particularly among middle- and lower-income households seeking cost control.

At the same time, premium and “affordable luxury” categories will continue expanding. Higher-income consumers are expected to increase spending on travel, dining, wellness, beauty, and subscription-based services. Rather than broad-based discretionary expansion, spending will concentrate in categories that deliver perceived quality, experience, or status.

Digital commerce will continue its structural rise. E-commerce penetration is projected to reach 28% of total retail sales, driven by convenience and improved price transparency. Artificial intelligence–powered personalization will influence approximately 84% of digital shoppers through product recommendations, dynamic pricing, and predictive marketing, raising conversion rates and deepening customer targeting.

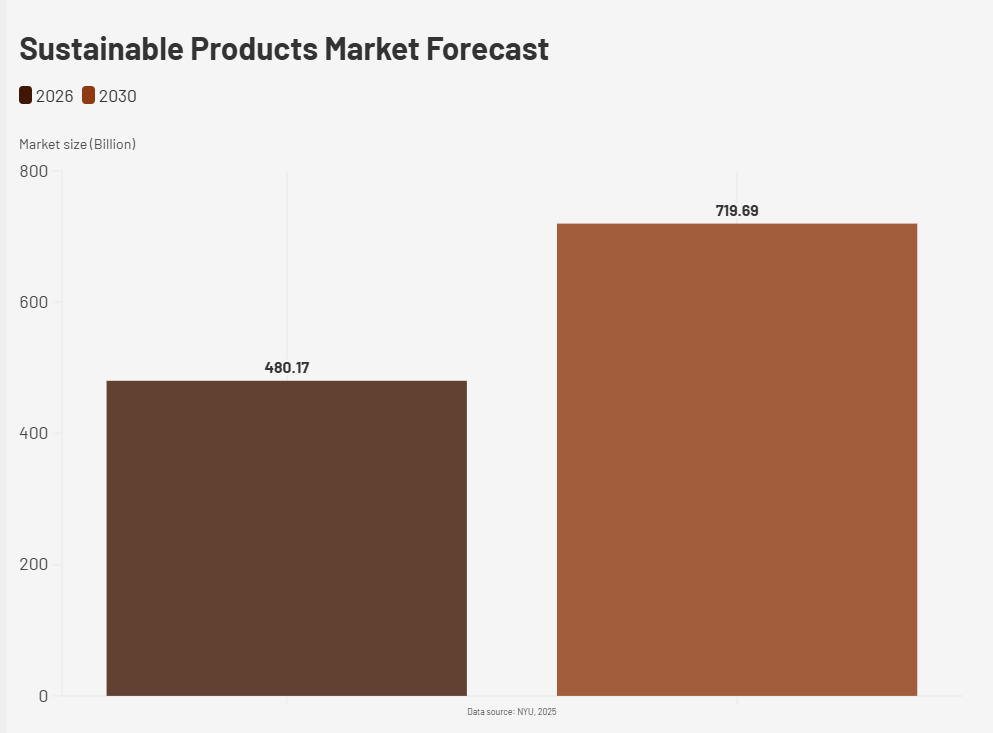
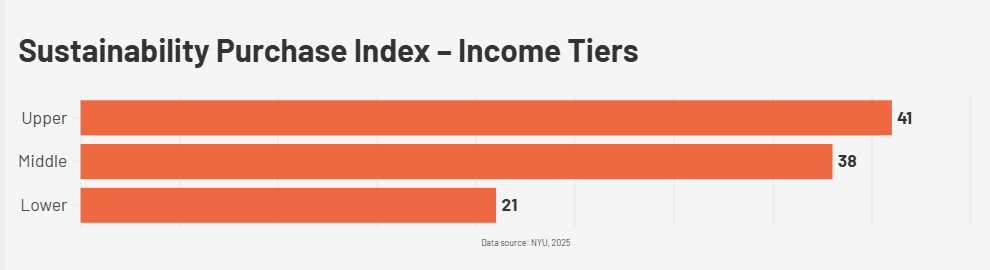
Sustainability preferences will stabilize rather than accelerate. Consumers are expected to tolerate price premiums of roughly 10–12% for sustainable products, but willingness to pay beyond that threshold will remain limited. This suggests sustainability is becoming an expectation in some categories, yet price sensitivity continues to constrain mass adoption.

The overall result is a strengthening barbell structure in the economy: premium and discount segments gain momentum, while the traditional middle market faces compression. Businesses positioned clearly at either end of the value spectrum are likely to outperform those competing on undifferentiated mid-tier offerings

Premium & discount win · Mid-market compresses
Strategic Implication

2026 will reward adaptability over scale, diversification over concentration, and long-term resilience over short-term optimization.

In 2026, resilience becomes more important than pure optimization. Economic divergence, automation, climate risk, trade fragmentation, and labor change create persistent volatility rather than temporary disruption.

Businesses must carefully manage three key trade-offs. They need to diversify supply chains to reduce risk while still maintaining cost efficiency through scale. They must invest in reskilling and upgrading their workforce, even if it reduces short-term profit margins. And they must decide whether to focus on higher-margin premium customers or compete for volume in increasingly price-sensitive markets.

Three Key Trade-offs for 2026
Diversify supply chains to reduce risk
While still maintaining cost efficiency through scale.
📈
Invest in reskilling and upgrading their workforce
Even if it reduces short-term profit margins.
🎯
Focus on higher-margin premium customers or compete for volume
In increasingly price-sensitive markets.